Panelists


Software testing covers a lot of areas. Perhaps one of the most important, yet often overlooked, is the quality of the data that is both part of testing and the actual business.
To that end Matthew Heusser and Michael Larsen welcome Naren Yalamanchilli, David Small, and Ken Wrem to talk about Datagaps, a company that is focused on making sure that Data Management and Data Analytics are in place so that companies can make sure that they have the best data possible to do business successfully.
![]()
References:
- Datagaps: https://www.datagaps.com/
Transcript:
Hello, and welcome to The Testing Show.
Episode 132.
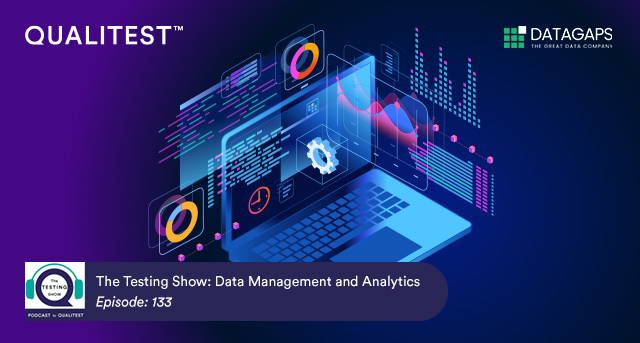
Data Management and Analytics with Datagaps.
This show was recorded on Thursday, December 29, 2022.
In this episode, Matthew Heusser and Michael Larsen welcome Naren Yalamanchilli, David Small and Ken Wrem to talk about Datagaps, a company that is focused on making sure that Data Management and Data Analytics are in place so that companies can make sure that they have the best data possible to do business successfully.
And with that, on with the show.
Matthew Heusser (00:00):
Well we’ve got a little bit of a different show for you today. Usually we talk about testing and quality, but our interest today is more in production quality, the quality of our data. We talk about test data management and trying to get the test data in a stable, predictable format, but there’s a great deal of quality insights that can be gained from production data if it’s right. And if it isn’t, then it’s damaging in the worst case and the best cases, the tools and the investments we make go unused. One of the companies that Qualitest works with is called Datagaps. They specialize in identifying and resolving those gaps in production data, which makes the quality of your data better, which should make better decisions, sort of a broader view of quality and one that I don’t think we talk about enough. So let’s welcome our guests to the show today starting with Naren Yalamanchilli, who is co-founder of Datagaps. Naren was a manager, executive, a couple of places, Oracle, IBM , where he found these problems and some solutions. That’s a terrible introduction, Naren. Tell us a little bit about yourself.
Naren Yalamanchilli (01:21):
Thanks for that. It’s a good introduction. From the long time ago, when I started with the work with Oracle and IBM, I’ve worked in the data warehousing projects. That’s basically the data and the data quality and data analytics always interested me. So that’s my core area of strength, actually.
Matthew Heusser (01:40):
Well thanks. We’ve got three guests today. We’ve got Naren, David Small and Ken Wrem, who’s a tester. So let’s go to David next. He’s an executive at Datagaps. You’ve been around data and logistics analytics for a long time, starting with a bachelor’s degree in business with an emphasis in computer science from Missouri State University. Where did you become interested in data quality?
David Small (02:10):
Well, I’ve been in data analytics, data movement, and data quality for the majority of my career. I’m glad you didn’t say when I graduated. I very much appreciate that. So early on I started working as a Cobol programmer but very quickly realized I wanted to do something a little bit more dynamic. That was in the early stages of analytics. Used to actually be called 4GL; four generational languages that were generating what we now call data analytics. And that all morphed into the more modern data analytics stacks that we have today with Tableau and PowerBI. I worked for Information Builders for a number of years and probably the last 10 or 12 years there. Ran the international division for Information Builders. So it had a very nice view of the global view of how people were needing to use analytics to run their business and the problems that they’d run into and ultimately started with Datagaps and from that point forward been focused really on making sure that people are making good decisions based upon trustworthy data. You know, that’s a lot of what we do.
Matthew Heusser (03:27):
Well thanks. And we still have to introduce Ken Wrem, who’s test data manager, data quality expert at Qualitest. You were doing that for years and years before that. And if I go far enough back though, you spent 16 years at Sears as a consultant, bounced around a little bit doing programming. So I get to ask my wonderful question. You’ve made the transition from development to testing. What interested you in testing and what made you wanna come over here and stay?
Ken Wrem (03:59):
So as you said, I’ve been in this business a long time. I was actually an employee for Sears and was an employee for many organizations up until about 10, 15 years ago when I started getting into the consulting work. My background in those companies is in application development and support. Understanding the data and how it impacts businesses at all levels is a critical part of that that I’ve learned over the years. That’s gotten me into my job supporting both data quality initiatives as well as test data management initiatives. And that’s what’s led me to Qualitest to join their data COE. Technically, I am not a tester and quite honestly have never been a tester, other than what I needed to do to do all of the above over the many years before we started isolating all of those things. My interest in data is in making sure that it is quality data, whether it’s used for testing or testing the data itself or monitoring it in production.
Matthew Heusser (05:06):
Thanks Ken. Yeah, I can see the distinctions you’ve made there. I appreciate them. And of course as always we have our show producer and co-host Michael Larsen. If you don’t know who he is, you will by the end of this show. Hi Michael, thanks for coming.
Michael Larsen (05:21):
Glad to be here as always. And interestingly enough, data and data transformation is kind of my bread and butter work and has been for the past several years. So I’m approaching this not just as a interest in bystander but also a client who deals with this.
Matthew Heusser (05:39):
Speaking of which we should probably start with the name, Datagaps. What is a “data gap”? Why did you name the company Datagaps? Naren? Can you tell us a little bit about that?
Naren Yalamanchilli (05:50):
We started when I was at Oracle when I used to lead a group that was building the largest data warehouse at that time of Oracle Analytics. And every release when we used to go to production, we used to encounter some kind of issue. It could be as bad as the entire columns being misplaced or mis mapped to some columns of data not having data at all. Different issues. And then the amount of volumes of data that we used to process make it very hard to recover from these type of issues and often resulted in loss of trust in what we were doing or what data we were displaying in the reports or the analytics piece was also having similar kind of problems like regression issues and performance issues and things like that. All these issues when we were making these releases, we didn’t have any access to any tools to test it, test testing, automate the testing. We tried different application testing tools but all the testing tools were focused on application testing, not on data testing. These data gaps, We suffered through it for a couple of years before I thought we need to do something about this. That’s how started Datagaps and name the company after it Datagaps.
Matthew Heusser (07:01):
Well thanks. I see… I suspect if anybody here has been around long enough, they’ve seen some of these kind of problems but can we talk about ’em a little bit more depth, maybe some examples of how they show up in the world? Are we talking about corrupt data? Out of date data? Incorrect data? Missing fields in the database? Is it not making it from the operational database to the data warehouse? And is the data not transferring between systems? Can you give us some more examples of what those Datagaps are?
Naren Yalamanchilli (07:34):
So for example, at the time of ingestion, like as we get data from external sources or into the application database, so there may be data quality issues there that are then duplicated across your enterprise into your reporting systems and warehouses across different systems that consume this data. That’s from there and as data is transformed and might move into different staging to aggregate and different layers of your warehouse and data pipeline, the data transformation issues could cause inconsistencies or incomplete data to be populated in all these different warehouses. So that can cause analytics reporting issues. And then in the beginning when we do the unit testing, these tests may pass and because we are focusing on a particular data pipeline or a particular task in a pipeline, but as you make changes across systems could be changes in your source system or E T L or your warehouse or your upgrades to your e-reporting platform. Issues creep into the system like big regression issues, stress testing, performance issues and those issues are difficult to identify without the automated testing and validation. So to answer your question, the issues all of once you mentioned and as well as inconsistencies across your different systems as well as data quality issues at an individual dataset level also are a problem.
Matthew Heusser (09:04):
Well thank you, Naren.
Michael Larsen (09:06):
So again, I guess the question that I would throw out here is, and I always approach this from my own avenue and angle of being somebody who actively works with data as their primary thing because that’s what most of our customers actually really care about. It doesn’t matter if our features do X, Y or Z as long as the data that they have represented actually does what they need to do. For somebody whose role is data integrity or whose method is going to make sure that things are actually working, what are some of the key things that you look for or what are some of the things that you most pay attention to to say, “Hey, yes, we’re doing what we need to do here” or, “Oh no, we’ve got a problem here, we need to make sure that we address this”?
Ken Wrem (09:50):
I could give you a real world example. You mentioned my days at Sears. I’ve also worked for another retailer over the years as well. At that one I had a inventory cost accounting manager come to me cuz I was working with a data quality team that we had there at the time and she was having an issue in one of the regions that was slipping in margin and nobody could figure out why. And so we talked it through about this and it was grocery store. They use a average cost calculation so that it never matches the actual cost that gets sent to the store because that goes into that averaging equation. So we talked about this, we identified cereal as a highly volatile pricing area and so we came up with a process where we would look at this and essentially create a report that would tell them how far off of that average cost or the actual cost that was last sent to the store was when they reported sales.
(10:56):
I gave her a sample report about two weeks later and there happened to be three stores in it that were purple, which meant that they were really bad and she goes, “Was this mocked up data so you could show me what it looked like?” And I said, “No, that’s live data we pulled from those stores last week”. And she goes, “Oh my God, you’ve identified where our problem is”. And then they went off to figure out why the cost was not being updated in those three stores. But that’s a really good example of monitoring value of data that I see in Datagaps.
Matthew Heusser (11:31):
So you’re saying there’s two different systems and you had a system that was more accurate that had the data that she needed?
Ken Wrem (11:38):
We had a system that was the source of truth of that cost and then the average cost that came back from the stores that was slowly getting further and further from that truth.
Matthew Heusser (11:48):
And it would be nice if we could systematize those kind of insights with a product that could find those differences for us. And I think that’s where Datagaps comes in.
David Small (12:03):
That’s a great use case for some of the things that we do. You know in that particular case there was a stream of data that kept coming in and all of a sudden the metrics, the numbers begin to get out of kilter. There’s a number of ways that you could help find that. One we sort of talked about a little bit and that is reconciling data that’s in your analytics platform back to the source of data. That’s a typical use case with Datagaps in RBI validation capability. So you can look at the underlying data supporting that report but also tie that back to a query that goes against the source data and and do the comparison. That’s one way. Another way is that we’ve built in artificial intelligence in the technology. What it does is data is coming into the enterprise and as it’s moving through the enterprise it begins to learn about that data.
(13:09):
And in this particular case where things begin to get out of sync because it’s learned about the data, it would identify those anomalies where things are getting outside the bounds of what is normal. From there we would flag that as an anomaly, which it may or may not be and you can investigate that anomaly at that point in time. So there’s a lot of ways that problems get interjected or issues get interjected in that overall pipeline from the point of ingestion all the way through to consumption. What we do is we help validate that entire journey. We have customers that are receiving thousands of external files from their clients or their customers and of course anything coming from the outside is gonna have its own set of issues and anomalies. So we help organizations to ensure the data quality of those things that are coming in that everything is properly formed, there’s not nulls where they shouldn’t be, there’s certain parameters that it needs to meet, we help it at that point in time.
(14:24):
And then as it moves through the enterprise, through your ETL processes and through your transformations and gets enriched, we help make sure that the actual results that you’re producing are what you’re expecting. And so we test to validate your data movement, whether it’s a migration or moving through your ETL processes. Anomalies get interjected into the data analytics side because you generate a new version of your particular application or you put a new version of your underlying data analytics platform, you’ve gone to a new release. Anomalies get introduced at that point in time as well and we help find those through regression testing and performance testing and report to report comparison. So we actually compare at a graphical level pixel to pixel to see if Report A that you ran two days ago is still now on sync with Report A that you’re running today.
(15:30):
So there’s all kinds of ways that you can help find those kinds of anomalies. But the important thing is to be able to find them first of all as early in a process as possible because they’re easier to fix and correct at that point. And also find them before the cat’s out of the bag. We have one customer that produces a lot of reports publicly. They absolutely were very concerned they would publish information that was inaccurate and would be consumed by the public. So they came to us to help ensure that that didn’t happen. Catching it early and certainly catching it before it’s consumed and decisions are made based upon that invalid data.
Matthew Heusser (16:17):
Well that’s a great high level description. Let’s drill in a little bit. Tell us about that first customer. What problems did they have?
Naren Yalamanchilli (16:27):
The first customer is a very large financial customer. They process retirement data. This was back almost 10 years ago. They were getting files from all these different universities. These files came in different formats, different types of files and sizes of files. As they’re ingested they need to be validated, meaning that the files conforming to the expected format or a data contract or it can be that the data itself, does it have anomalies like David mentioned? Are the number of records as expected for example for a file that is coming in from particular university? So all these files data as they ingest they wanted to check the quality of the data. Second thing, after they process these files, they produced another set of files that were actually consuming further down in the data pipeline. So they wanted to validate that the data got transformed properly and right type of files are getting generated and all the records that came in have been processed successfully and then they have already into the target file system that they were using. So that was our first customer and they stayed up to this day, they used our product and actually multiple other teams have started using our product as well in that customer.
Michael Larsen (17:44):
So is this something that you would do on a one-to-one basis or is this… I suppose, I guess what I’m asking here is if I’m working with a data transformation for example, I’m doing it for one organization that one organization has special rules and things that they need to keep track of. And so I have a kit if you will that I have set up to say if I’m taking from organization A and we’re getting it from this system and it needs to go to that system and then in between is this what I call my rule book? We roll it through the rule book and I make sure that if rule book has been applied, what came in and what goes out while they’re not identical, I at least know what the variations are and I can pinpoint what those variations are and say, “Yeah, based on this and based off of these seven criteria, I know we’re good.” Is that the same thing you’re dealing with it from like a one-to-one with an organization and would you have different rules or ways that you would work with that if you dealt with somebody else or is it something to where you’re kind of hoping everything that comes in can be massaged and worked with on a more uniform level?
David Small (18:54):
I think every organization has such a variety of data that’s coming into their enterprise and the rules that apply to finance maybe don’t apply to manufacturing but they all have the same type of problems. The data has to be accurate. In finance, if they’re wrong, maybe you bill a customer the wrong way. In manufacturing maybe you ship the wrong products. Every organization will have many different feeds that they want to validate and that they want to move through a process and ultimately moves into a data analytics platform where they make some decisions based upon that data. The data quality rules, the transformation rules, reports and dashboards that you generate are all considerably different. So I think it really depends upon which part of the organization you’re working with and also the types of data they’re dealing with. If you’re dealing with IOT data, you may be a little less concerned about the data quality because it’s machine generated and maybe you’re looking for anomalies that are caused because of different things, as an example.
Michael Larsen (20:16):
Let me give an example of something and maybe this is a little bit of a weird one but it’s one that I just gave a talk on and I find this to be fascinating, because you just mentioned the internet of things and this reminded me of something that I’ve actively been testing and dealing with. This has to do with fitness apps and specifically it has to do with an application that deals with data that’s coming off of scales. Your electronic scale that you might have at home and a number of these products if you will utilize body fat percentages. It seems like it would be something that, oh hey, you know, you step on your scale and you have a certain number of values that come in that should be relatively easy to correlate. But there’s one number that is maddeningly weird and I’ve seen this with a number of different organizations and that is body fat percentage the way that many scales if you will.
(21:13):
And again, I’m just using this as an Internet of Things example, cause I think this is an interesting way that this might pop up. Just from the simple factor of if you happen to go out and work out that day and you’re hot and sweaty and warm, you’re gonna get one reading versus if you just wake up and you haven’t had a whole lot of water to drink and you’re dry and you step on the scale, you’re gonna get two radically different readings. I can only imagine if you are an organization that’s trying to make trends or trying to figure out if let’s say you’re working with a group of participants in a study like a type two diabetes study or something where you’re trying to get a clear indication of how people are progressing and you’re getting what can only amount to a potential tremendous amount of line noise. If I’m stepping on a scale one day and I’m giving you a body fat reading of 26% and the next day I’m giving you a body fat reading of 14%, you gotta be sitting here going, “Something is dramatically wrong here, what is going on?” But these things just happen because of the vagueness. So how would you be able to deal with something like that? How do you know when your data is wrong or it’s just you’ve got a volatile sample set and you’re not a hundred percent sure what is the right reading?
Matthew Heusser (22:34):
I think a more abstract way of saying what Michael gave us a concrete example of is sometimes you have external people entering data that looks funky or it’s coming from a system and it looks funky. It would be nice to identify it as funky or even say this is line noise, this is error. But sometimes that’s just what they entered. The guy at the bookstore really wanted to buy 75 copies of that book, which throws off all your averages if you’re a retail book seller. We talked about missing data, we talked about corrupt data, we talked about data that was clearly wrong. Can Datagaps speak anything to the middle space?
Naren Yalamanchilli (23:17):
There are a couple of things that Datagaps does to solve this type of problem. One is concept of seasonality. Seasonality is if you are getting data in the example that can give earlier inventory data you’re getting on a daily basis. The inventory may be, levels may be different based on the day of the week or time of the day for example or month of the year, things like that. Historically based on most on the data that you caught for that time of the day or year or month, it keeps track of all that historical information and learns from it using the AI algorithm. And it is also able to understand the holiday season because you might have different numbers on holidays. So all these factors going to consideration when it comes up with a predicted range of the values that basically it says the next value should be falling under.
(24:12):
And then on top of that there are threshold limits also that end users can specify saying that it should be within certain thresholds. So these are all different ways to come up with and know obviously identify anomalies and not all anomalies are bad. Like you mentioned like someone buys a book, 75 books. Certainly in a particular store maybe it’s not a problem. So there are controls to ignore up to certain number of anomalies also that’s why we call them anomalies. We don’t call them error but definitely there are controls in machine learning algorithms to make it more or less alleviate the problems of identifying false negatives.
Matthew Heusser (24:50):
So I think what I hear you saying is in manufacturing process we can put tolerances for error and then if we exceed those tolerances we say the process is not in control. Likewise, we can put boundaries on things like averages, means, medians, modes, and if we exceed those tolerances we can file a flag and say, “There might be something for you to look into here. I don’t know if it’s right, I don’t know if it’s wrong, but this seems to be not what you expected as the data flows through the system.”
Ken Wrem (25:22):
I can add a little bit to that from my experience with some things from a perspective of there are tolerances to your point and this comes back to what are the data rules that drive quality data. In your example with the body fat, what are the limit that really are realistic but might be off for one day and not necessarily be an anomaly? Well on the other side of that, I worked with a guy who told me years ago that worked for the Department of Transportation and they had temperature monitors all over the state monitoring the temperature so they would know when to start going out and spraying for deicing and things like that. But one of the things that he did, and this was long time ago, he had to write a process that basically said, “If I get a reading that’s coming in and says the temperature’s 150 degrees, that is definitely an anomaly”. But it’s one that they needed to address because it was not necessarily that it was just because it was a bad temperature, but it was often indicating the sensor itself was going bad and they had to send somebody out to replace it. That’s part of that process from a perspective of what defines that anomaly and then what is your reaction to it, which is important, but it all comes down to what are variances that are acceptable versus a variance that’s not.
Matthew Heusser (26:47):
Yeah, that makes a ton of sense. Thanks Ken. That sort of brings us back to now we’re gonna have the correct data in the warehouse or the lake or wherever the data is, but I think it’s fair to say we see slow adoption of data analytics tools. We see companies that invest all this money in Tableau and they pull reports that are remarkably similar to what they were doing 10 years ago in Crystal Reports. To sound critical, why should we dump more money into tools that aren’t being used?
Ken Wrem (27:19):
One of the questions I like to ask is, internal people within your company, do they trust the data? And frequently the answer is no. That is one of the main considerations driving to your question about why are they not adopting this? And that’s because data anomalies do get into the analytics and that’s what needs to stop so that people will trust the data going into the analytics so that they will trust the results coming out. Those are the types of things that a tool like Datagaps can help you get there quicker to keep that data from getting into the engine to begin with.
David Small (28:01):
I’d like to add onto that. We read studies where organizations have spent hundreds of millions of dollars in their data analytics platforms over the course of a number of years. It still falls back to many people don’t trust the data so they don’t adopt that data analytics platform and that millions of dollars worth of investment is sort of lost. For a relatively small amount of money, what you can do is go in and improve the trusted data by doing the validation of the data journey. And at that point in time people begin to accept the fact that, “Okay, we are testing it, it is being validated and we can see the results of the validation.” So therefore now we trust that the data is accurate and we trust that the the values in the dashboards and the reports are accurate now. It’s sort of a way to reclaim some of your lost investment in the data analytics platforms simply by doing some additional tests at the data level.
Michael Larsen (29:11):
I guess the final question that I was gonna ask and final thing that I would be curious about is if you were to elevator pitch this to somebody who wants to say, “I want to see what Datagaps is gonna be able to do for me?”, why you? What makes you the company that I want to talk to about this? How’s that for a loaded question?
David Small (29:30):
<Laugh>? Yeah, we thank you for teeing that up for us. What differentiates Datagaps from other players out there? One is that we focus on the complete data journey from the point of data coming in, whether it’s from your production applications, applications that you need to have accessed via an api, JSON or XML or CSV files, it doesn’t matter to us. As that data comes into the enterprise, we validate it, make sure that it’s properly formed, and then as it moves through your pipelines, we provide you the ability to be able to check your ETL processes and that they’re staying inconsistent as data moves through the enterprise. And then finally, as it hits the data analytics platform, we do the regression testing, report comparisons, stress testing, and functional testing. We cover the gamut of the data from the point it comes in to point where it gets consumed.
(30:36):
That’s one of the main differentiators. The other differentiator is the technology that’s underneath the covers in most of what we produce and it’s all Apache Spark-based and we layer a framework in on top of Apache Spark, which gives us the ability to scale, to run on multiple platforms and the ability to handle more complex types of data validation testing. The other big differentiator is our approach to the market. We are very collaborative and there’s oftentimes, whether it’s a prospect or a client, I think we listen very well to ’em and we help find solutions to their issue. Even if it’s not exactly out of the box, there’s times that we’ll make modifications to enhance our product line to help them with their particular unique problem. And then probably one of the last things would be the ability to extend our capability. Our architecture is a component based architecture that has a lot of already out-of-the-box components, but we also have the ability to allow you to code in Python or Scala or even SQL.
(31:52):
And we can extend our capability by taking that code in creating plugins so those plug-ins can be reused across any of the people that need to access our technology. We try to be extensible, certainly able to handle volumes up into the billions of rows of data and the ability to handle the complete landscape in the pipeline. And then I’d add one more thing and that is work with your DevOps platforms, whether it’s Jira, Jenkins or any of the other ones, you actually can fire test cases within our technology from external sources. It’s really the breadth of capability that we provide that I think sets us apart in the marketplace.
Matthew Heusser (32:40):
Okay. So I would propose that for our last takeaway, we hand it to Naren, the co-founder of Datagaps, to tell us what he thinks.
Naren Yalamanchilli (32:52):
Thanks, Matt. As to what we have seen recently is that a lot of companies are embarking on digital transformation and moving to the cloud. Many of them are redefining or re-architecting their data pipeline and data processing strategies in the cloud using cloud-native services, whether it’s AWS or Azure. And when they do that, the data ops is a very important area. Just like application testing, data is a valuable asset today and we need to ensure that the data is tested properly, vanished properly, and then from a reporting standpoint validated and the reports can be trusted as well. From that standpoint, the partnership between Qualitest and Datagaps, Qualitest brings in the industry exposure as well as the expertise in testing. Datagaps has their tools to enable the automation. So I think from a data ops automation standpoint is the right time for enterprises to invest and make sure that they’re really putting the emphasis that needs to put on the data validation so that they can trust their decisions.
Matthew Heusser (34:00):
Thank you, Naren. And I think with that it’s time to call it a show. Thanks for being on the testing show. Appreciate your time everybody. Thanks for listening.
Michael Larsen (34:10):
Thanks for having us.
Matthew Heusser (34:11):
Thank you, Matt.
David Small (34:12):
Thank you.
Ken Wrem (34:13):
Thanks Michael.
Naren Yalamanchilli (34:13):
Thank you.
Michael Larsen (OUTRO):
That concludes this episode of The Testing Show. We also want to encourage you, our listeners, to give us a rating and a review on Apple podcasts, Google Podcasts, and we are also available on Spotify. Those ratings and reviews, as well as word of mouth and sharing, help raise the visibility of the show and let more people find us. Also, we want to invite you to come join us on The Testing Show Slack channel, as a way to communicate about the show. Talk to us about what you like and what you’d like to hear, and also to help us shape future shows. Please email us at thetestingshow (at) qualitestgroup (dot) com and we will send you an invite to join group. The Testing Show is produced and edited by Michael Larsen, moderated by Matt Heusser, with frequent contributions from our many featured guests who bring the topics and expertise to make the show happen. Additionally, if you have questions you’d like to see addressed on The Testing Show, or if you would like to be a guest on the podcast, please email us at thetestingshow (at) qualitestgroup (dot) com.